Search Results for 'sagarin'
-
Search Results
-
My guess, based on Sagarin predictor: Utah -13.5
Topic: Sagarin, S&P+ 11/12/18
The win against Oregon seemed to ‘right the ship,’ statistically speaking:
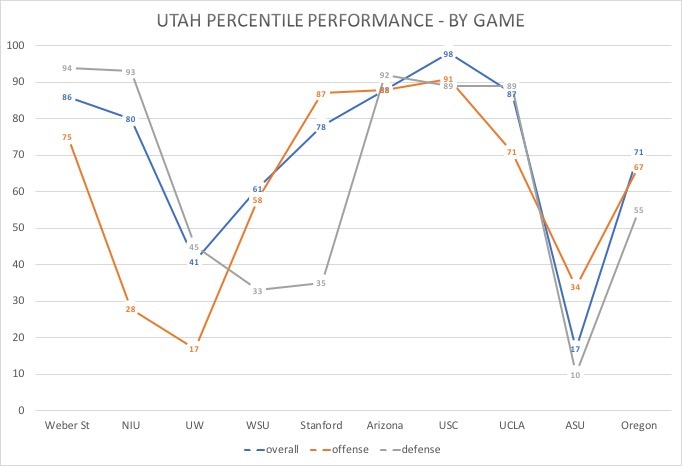
S&P+ ranks us 15 (+4), Sagarin 14 (+1). Both systems predict we will win both our remaining games; S&P projects we beat Colorado by 13 points and TDS by 15.
I became curious regarding the defense’s poor performances – were there any trends that would allow me to make some predictions regarding future performance? The defense seems to defend the run well, Rushing Defense S&P+ ranked 21, but struggle against the pass, Passing Defense S&P+ ranked 58.
The defense’s percentile performance average on the year is 64%. I looked at the games where the defense performance was in a percentile less than 64% (UW, WSU, Stanford, ASU and Oregon) to see where these teams had success against us. First thing to jump out at me were the overall rankings in passing offense:
Team ………. Off S&P+ ………. Passing S&P+
UW ………… 40 ……………. 23
WSU ……….. 15 ……………. 37
Stanford …… 20 ……………. 8
ASU ……….. 31 ……………. 35
Oregon …….. 28 ……………. 29All teams have overall offense ranking and passing offense ranking in the top 50. When I looked at the individual game stats, one metric was consistently better than average for our opponents: success rate on passing downs (Second-and-8 or more, third-and-5 or more, or fourth-and-5 or more). Here are the single game stats (Utah vs. Team)
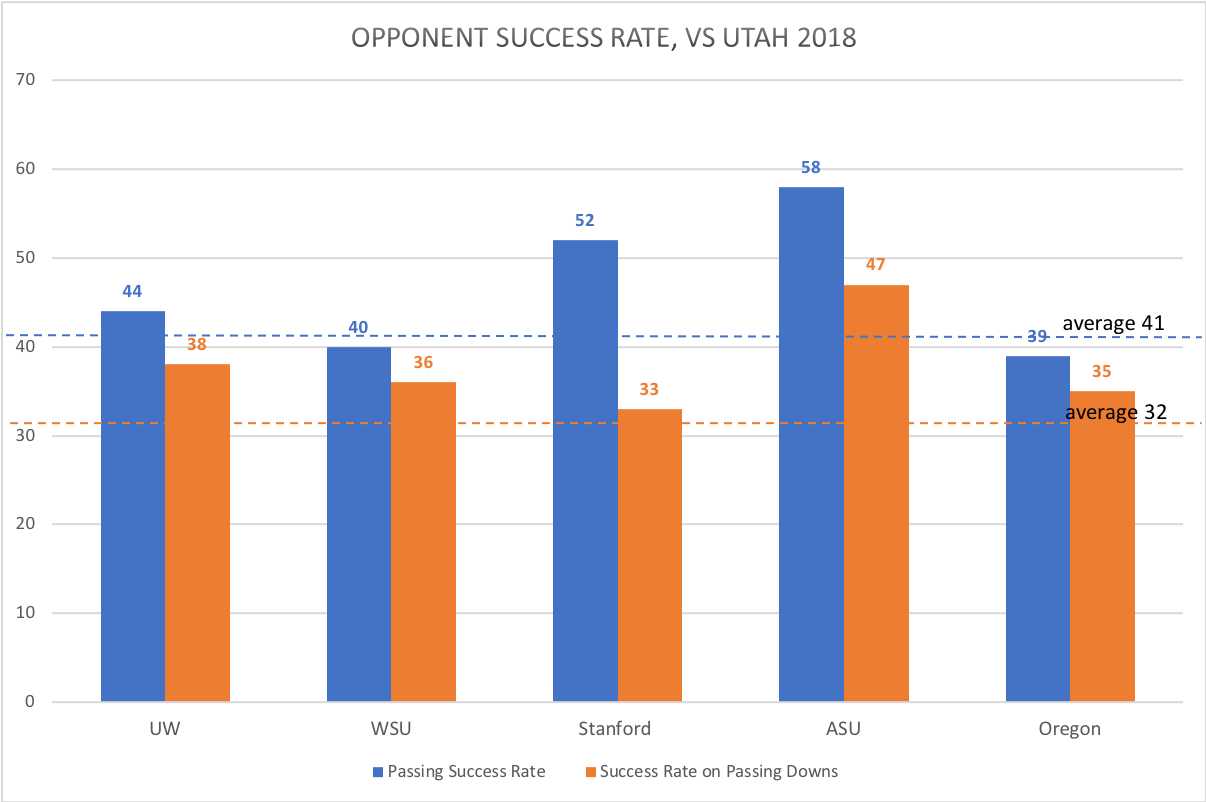
For whatever reason, when a good passing offense is in a ‘must’ pass situation, those teams are successful against our defense more often than average
So, the defense struggles to defend the pass – what does this mean going forward? S&P+ ranks UW 11 (below #10 Utah State) and WSU 16; this means that on a neutral field, UW would beat Utah by very slim margin (1.5) and Utah would beat WSU by a very slim margin (0.7). S&P+ predicts that WSU beats UW in the Apple Cup (51% probability), meaning if we win the south, we face WSU in the championship game.
Frankly, I would rather face WSU. UW’s defense, ranked 6th in the nation by S&P+, would give our inexperienced QB and RB fits. So I am cheering hard for Oregon this week and Wazzu next week – a lot has to happen, but the conference championship is very much in play!
Topic: Sagarin, S&P+ 11/7/18
Yikes, that was … bad. But not too bad, as reflected in the advanced analytics.
Sagarin ranks us 15th, S&P+ 19th. We dropped 5 spots in Sagarin’s system, 7 in S&P+, despite having our absolute worst performance of the season.
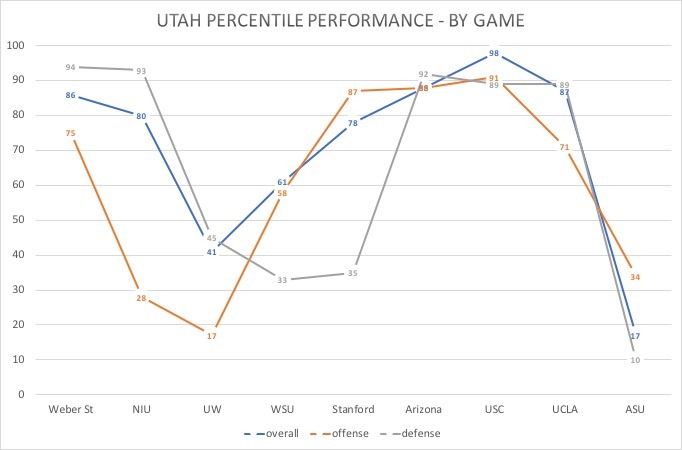
The defense had a terrible day, turning in a performance in the 10th percentile. Looking at the game specific analytics, the issue was N’Keal Harry and Brandon Aiyuk, who combined for 15 catches, 261 yards and 3 TDs. The ASU receiving corp caught 90% of their passes for 285 yards, with a success rate (definition here) of 67%. Harry was unstoppable, with an 80% success rate, and all three TD receptions. Eno Benjamin also had a day: 175 yards, 2 TDs and 56% success rate.
OK, so why didn’t Utah drop further in the advanced analytics? Because advanced analytics realize this game was as flukey for ASU as it was for Utah:
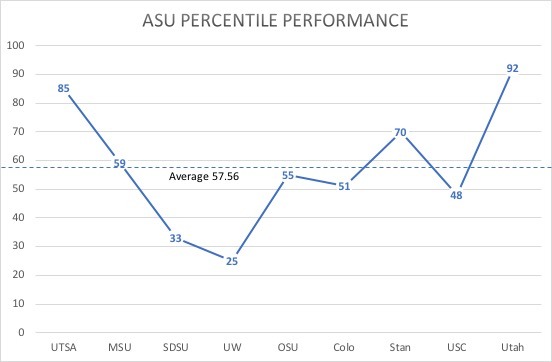
ASU’s S&P+ ranking jumped 10 spots following Saturday’s game, from 62 to 52, which is where they started the season. Both systems predict an ASU loss to Oregon.
A big part of the loss were Utah’s 3 turnovers, which are seen as ‘luck’ factors in most advanced analytic systems. Combined with the loss of Huntley, the stats people are ready to write this loss off as bad luck and move forward. By the way, we are projected by both systems to win out.
So, the analytics say that we absorb this loss and still have a very good chance to win the south.
NOTE – I am using Bill Connelly’s S&P system for this analysis. You can read up on S&P here
Has the offense improved under Troy Taylor? Eight games into year two may be too early to tell, but I took a look at a few S&P stats, just to see if there were any trends.
Sample size in football is an issue, especially with college football. There are a limited number of events to wash out the noise, as compared to a 162 game baseball season. Roster turnover occurs more often, as compared to professional sports. So with these caveats, I give you some data regarding the 2018 Utah offense:
First, let’s look at S&P+ stats, 2017 vs 2018
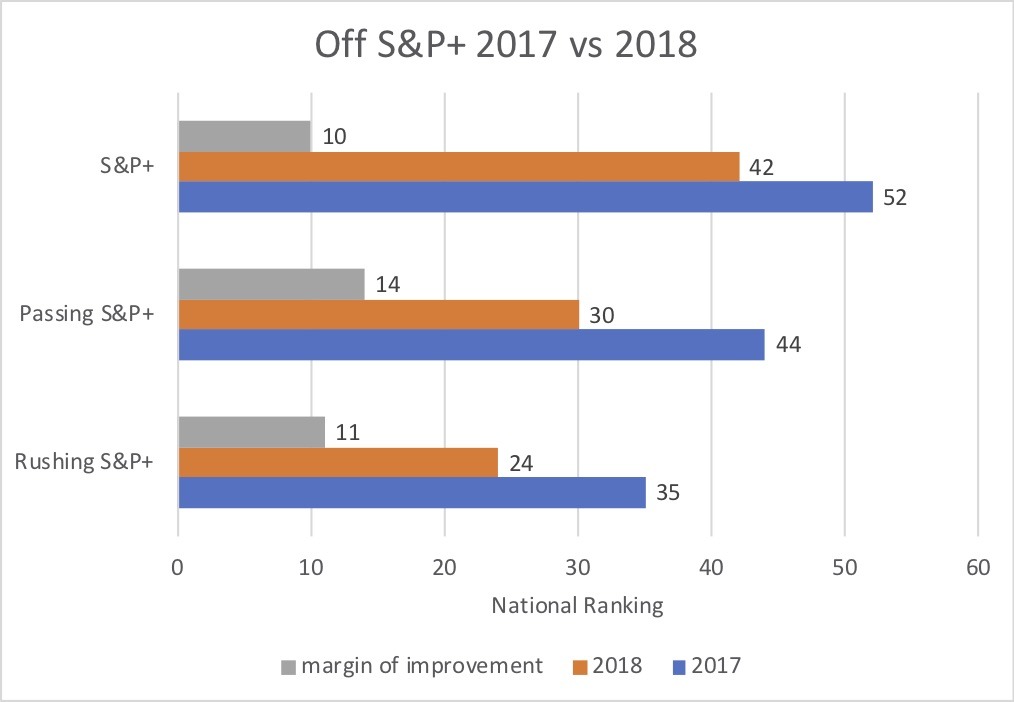
Utah has improved in every opponent adjusted statistic, most notably, a 14 point jump in passing S&P+. This made me curious about what aspect(s) of the passing game have improved, but I couldn’t find any improvements comparing 2017 to 2018 year totals. It occurred to me that the performance during the 2018 season has been split, with a huge difference between the first four games and the most recent four games. Here’s a look at team performance as a function of national percentile; I included the overall performance percentile, as well as offense and defense performances.
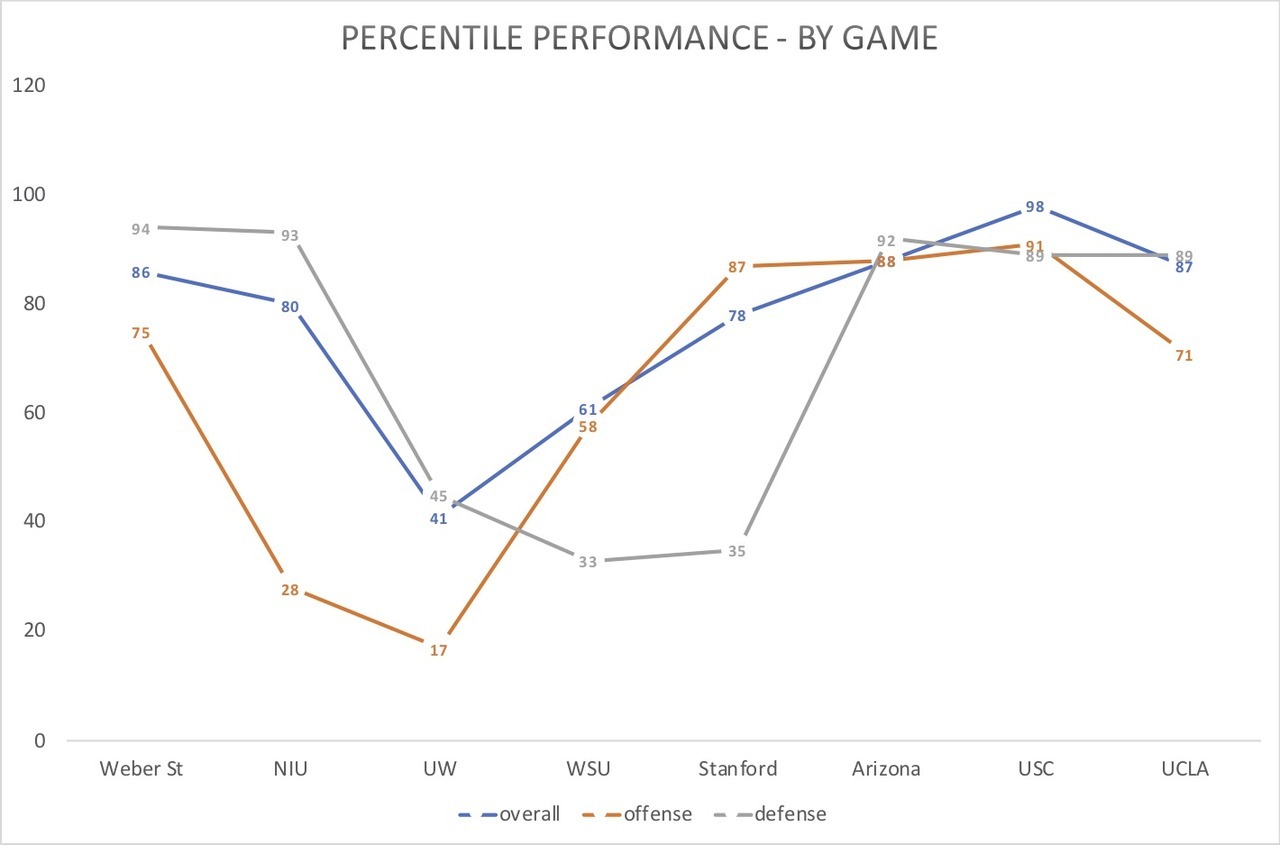
Huge difference in performance between the beginning of the season and now. Interestingly, the defense had a lull through the UW-WSU-Stanford games, and the offense finally came through in the Stanford came and sparked the turn around. When both units play at a high level – damn, we look good!!! See: 98th percentile performance against USC – offense 91st, defense 89th.
So, instead of comparing year total stats, I looked at success rate (defined as gaining 50% of required yardage on first down, 70% on second down, and 100% on 3rd/4th), broken out into passing and rushing attempts, across the 2018 season and saw a marked increase in efficiency as the season has gone on.
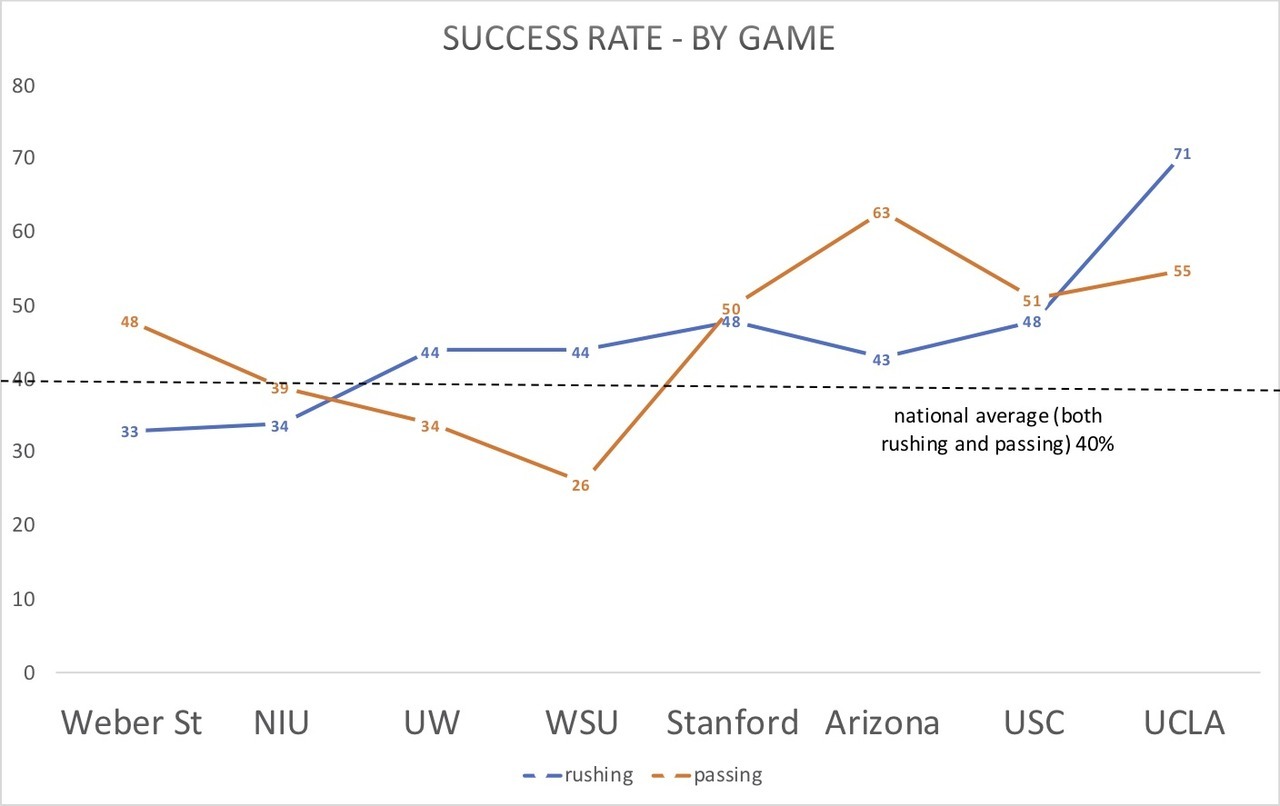
To me, the most dramatic turnaround has been passing success rate, which has been at 50% or above since the game at Stanford.
Two other factors stood out to me when looking at the individual game data – creating scoring opportunities, and translating those opportunities into points.
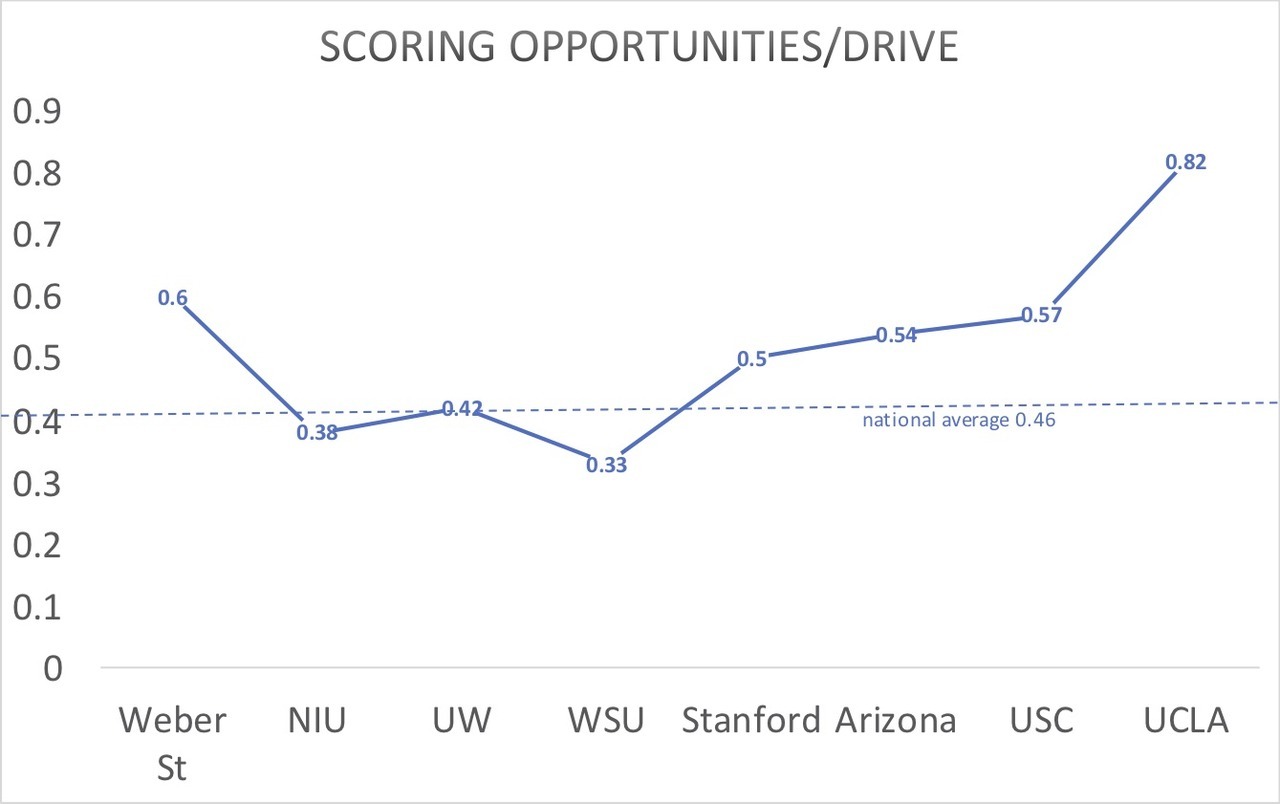
Utah is consistently creating opportunities to score, with 50% or more of their drives ending inside the opponent’s 40. They are also taking advantage of the increase in scoring opportunities:
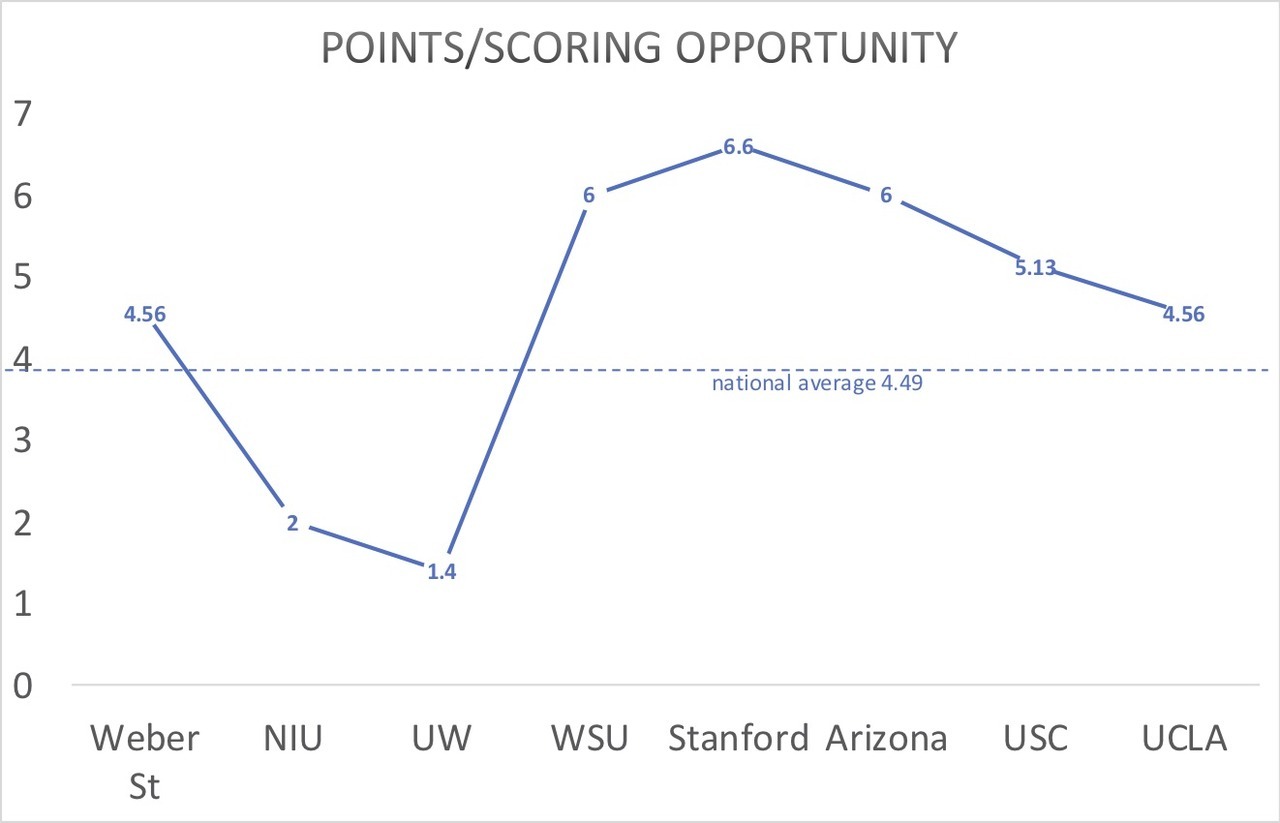
Way above average in points per opportunity for most of the last four games.
So, is this improvement for real? Or have we just been playing some bad teams? Connelly thinks our strength of schedule is pretty darn good – he ranks our Resume S&P+ at 12th in the nation.. (As an aside, the SOS argument is addressed in the post I linked to, and I suggest everyone give it a read – especially in regards to the G5 vs P5 in the playoffs debate).
S&P+ projects that Utah finishes the season with one more conference loss. I gave a breakdown of what that means for our chances at taking the Pac12 south here. I think even with the loss we win the south this year.
But back to the offense, is all of this for real? I guess only time will tell, but the metrics look to me like the offense has found its groove.
Topic: Sagarin, S&P+ 10/28/18
Winning solves everything.
Sagarin has us at #10, S&P+ has us #12. Both systems favor us in the rest of our games.
Despite the love we’re getting in the rankings, the narrative is essentially unchanged. We’re a game up on everyone in the south in the loss column. If we lose one of our last three conference games, the only way another team passes us is if the loss is to either ASU or Colorado (both 2-3 in conf), and if that winner wins all of their remaining conference games. So, the chaos of this weekend has given us a nice cushion for the remainder of the season. Best case scenario is to win out – less desirable is losing one of our last three, but we would still be in good position to win the south – lose two and we would need a lot of help to be south champions.
So, let’s do some projections for the Pac12 championship game!!!
Utah v Wazzu: both S&P+ and Sagarin give us a W
Utah v UW: S&P+ predicts a loss, Sagarin a win
Utah v Furd: both systems say we winPersonally, I would love to see a Utah v Wazzu championship game.
Here’s something else I thought was interesting:
S&P+ ranks our offense at #42, and predicts that we end the season averaging 31.8 points per game (we are actually averaging 31.6 ppg). Last year, we ranked #55 in Off S&P+, and were predicted to average 29.5 ppg (which was spot on – that is what we averaged). Connelly warns against comparing S&P+ numbers across years, and recommends using rankings for historical comparisons. So, moving up 13 places in the offensive rankings seems like good progress to me. I want to do a more in depth post comparing this year’s offense to last year’s offense, but Connelly is updating the S&P+ numbers today, so I’ll have to wait for those numbers and put something together later this week.
Just win, baby!!!!!
Topic: Utes 24th in Coaches Poll
S&P has us at 19
Massey at 17
Sagarin at 14
I think Massey is closest to being correct. Where would you place us?
