Breakdown of Offensive Improvement using S&P stats
Welcome to Ute Hub › Forums › Utah Utes Sports › Football › Breakdown of Offensive Improvement using S&P stats
- This topic has 3 replies, 4 voices, and was last updated 6 years, 8 months ago by
 noneyadb.
-
AuthorPosts
-
-
 shakeitsugareeParticipant
NOTE – I am using Bill Connelly’s S&P system for this analysis. You can read up on S&P here
Has the offense improved under Troy Taylor? Eight games into year two may be too early to tell, but I took a look at a few S&P stats, just to see if there were any trends.
Sample size in football is an issue, especially with college football. There are a limited number of events to wash out the noise, as compared to a 162 game baseball season. Roster turnover occurs more often, as compared to professional sports. So with these caveats, I give you some data regarding the 2018 Utah offense:
First, let’s look at S&P+ stats, 2017 vs 2018
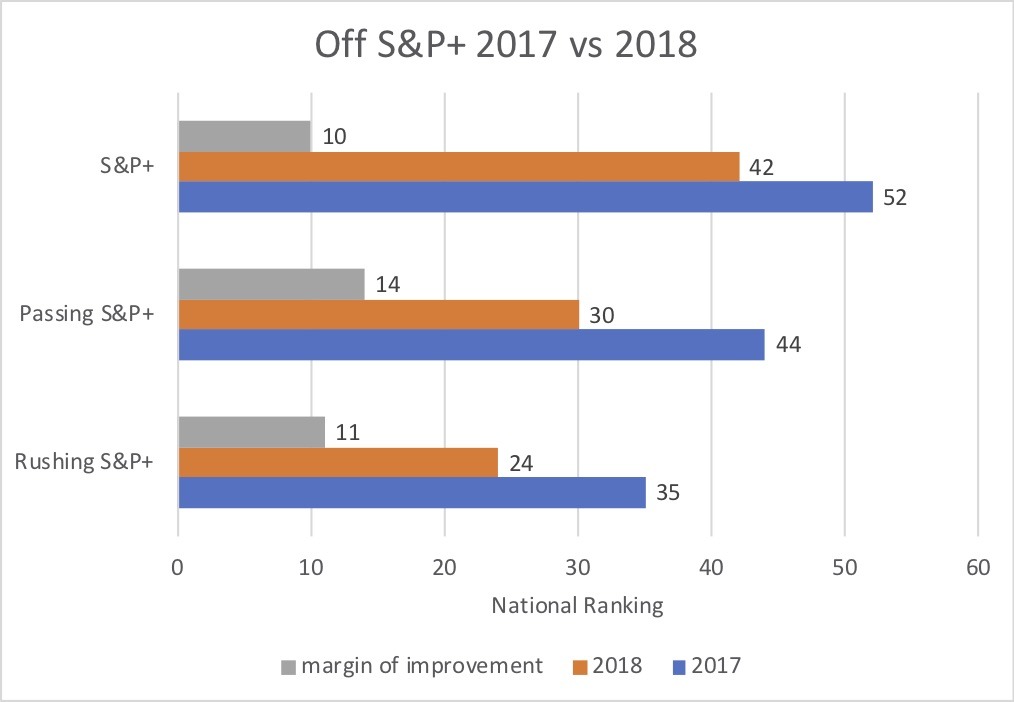
Utah has improved in every opponent adjusted statistic, most notably, a 14 point jump in passing S&P+. This made me curious about what aspect(s) of the passing game have improved, but I couldn’t find any improvements comparing 2017 to 2018 year totals. It occurred to me that the performance during the 2018 season has been split, with a huge difference between the first four games and the most recent four games. Here’s a look at team performance as a function of national percentile; I included the overall performance percentile, as well as offense and defense performances.
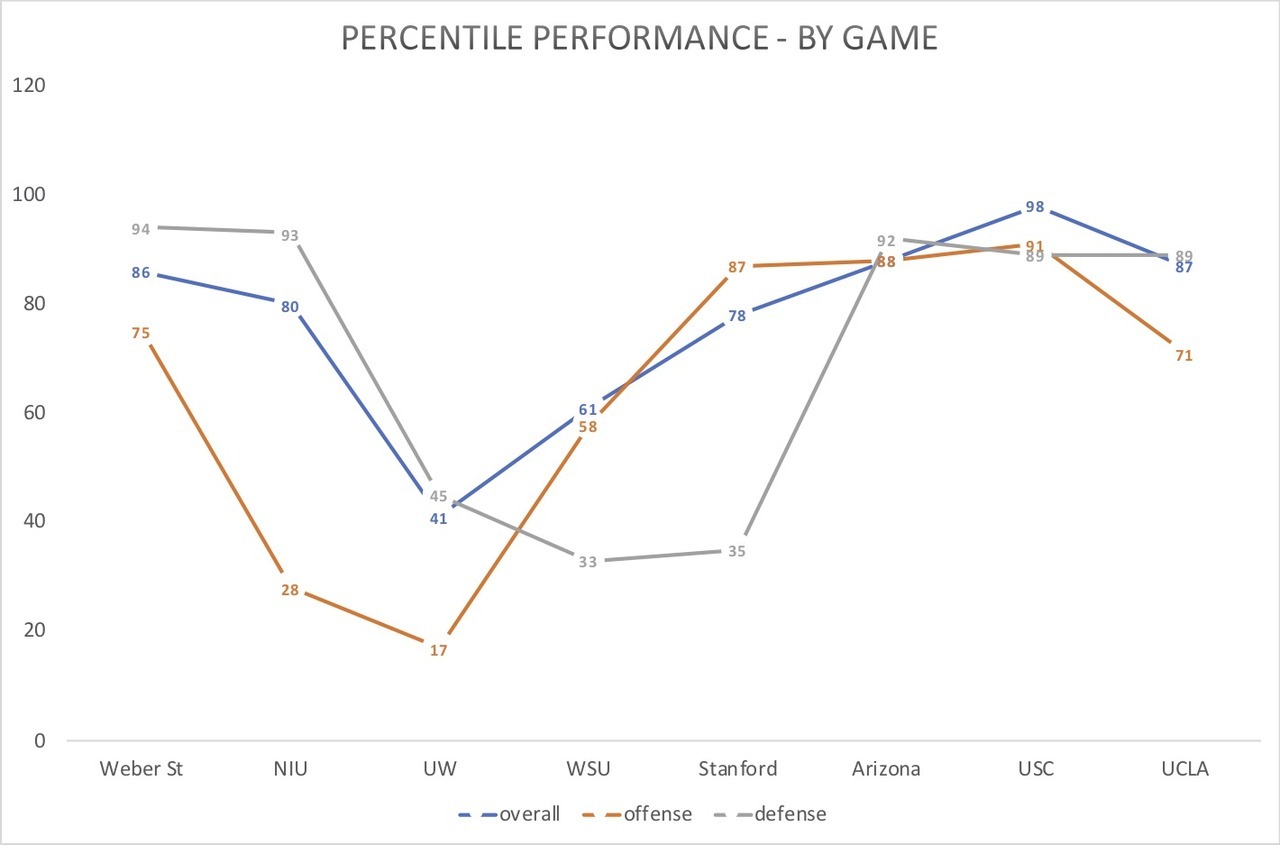
Huge difference in performance between the beginning of the season and now. Interestingly, the defense had a lull through the UW-WSU-Stanford games, and the offense finally came through in the Stanford came and sparked the turn around. When both units play at a high level – damn, we look good!!! See: 98th percentile performance against USC – offense 91st, defense 89th.
So, instead of comparing year total stats, I looked at success rate (defined as gaining 50% of required yardage on first down, 70% on second down, and 100% on 3rd/4th), broken out into passing and rushing attempts, across the 2018 season and saw a marked increase in efficiency as the season has gone on.
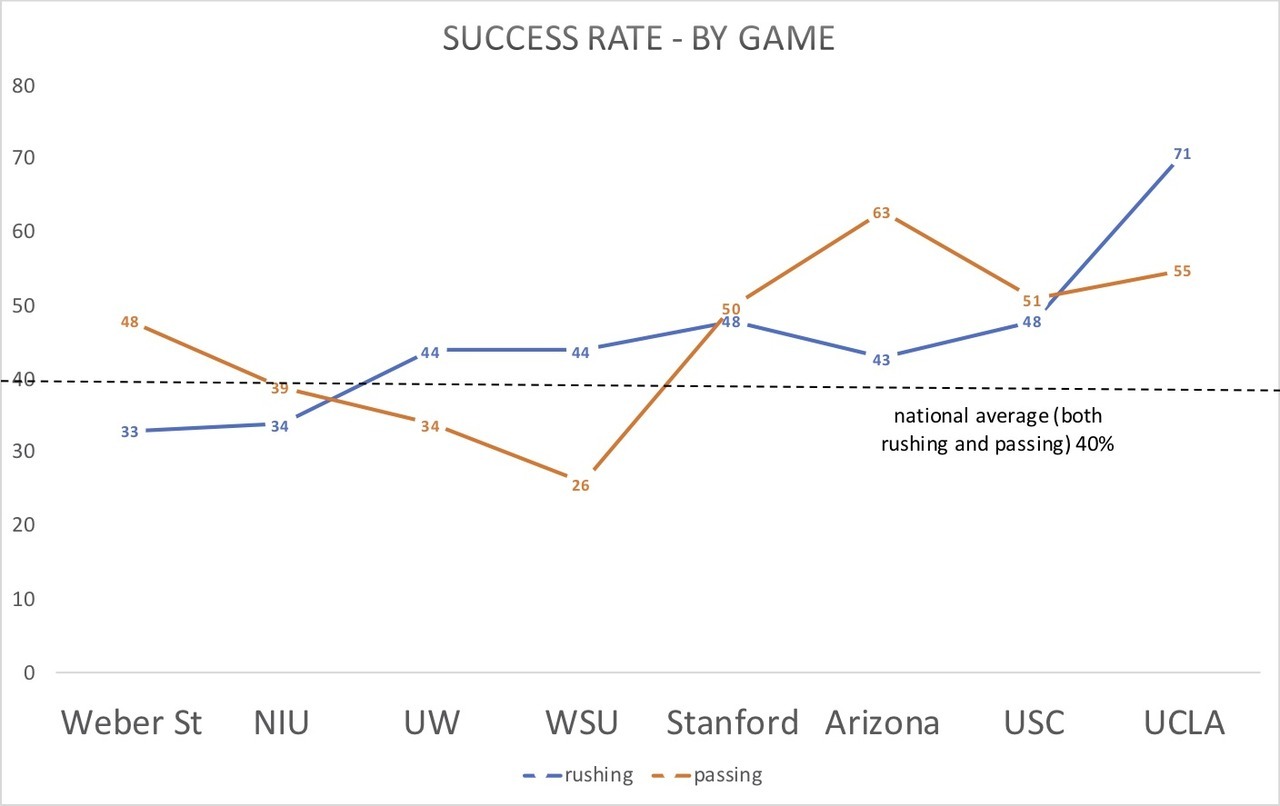
To me, the most dramatic turnaround has been passing success rate, which has been at 50% or above since the game at Stanford.
Two other factors stood out to me when looking at the individual game data – creating scoring opportunities, and translating those opportunities into points.
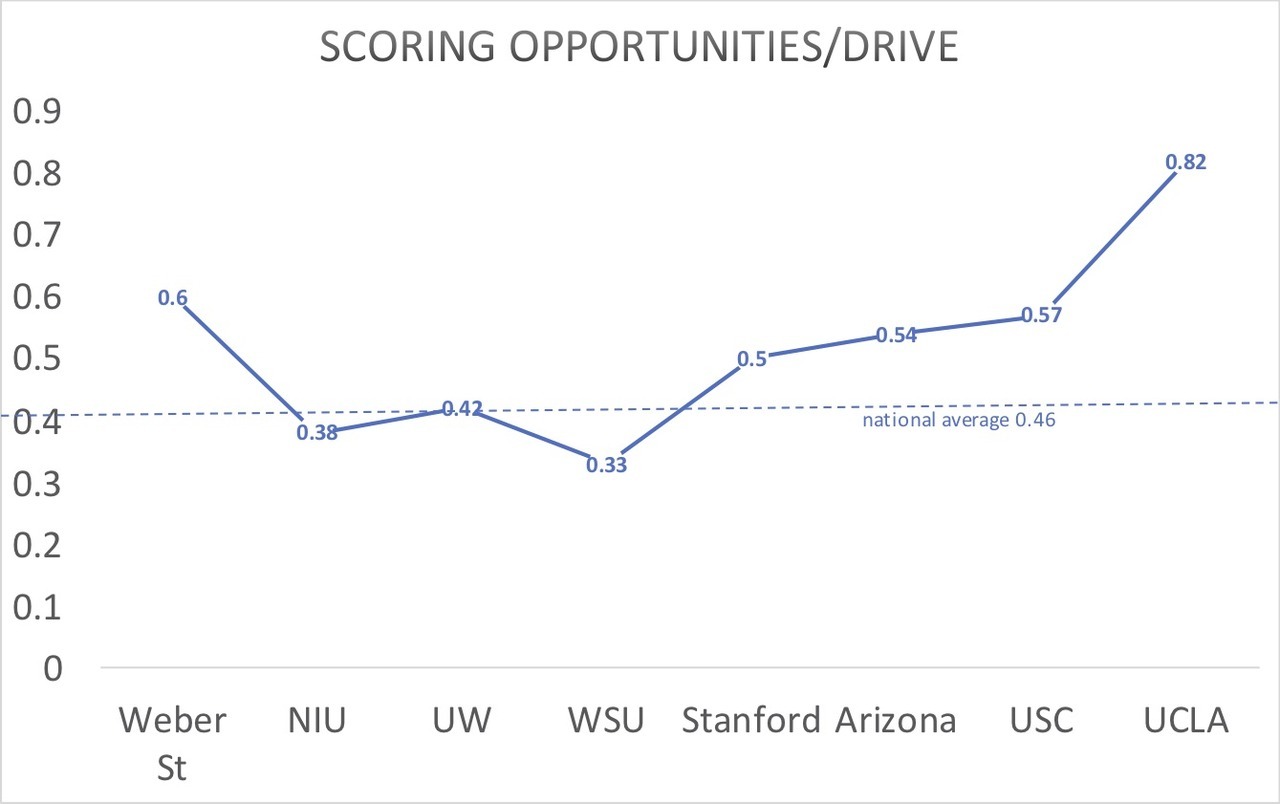
Utah is consistently creating opportunities to score, with 50% or more of their drives ending inside the opponent’s 40. They are also taking advantage of the increase in scoring opportunities:
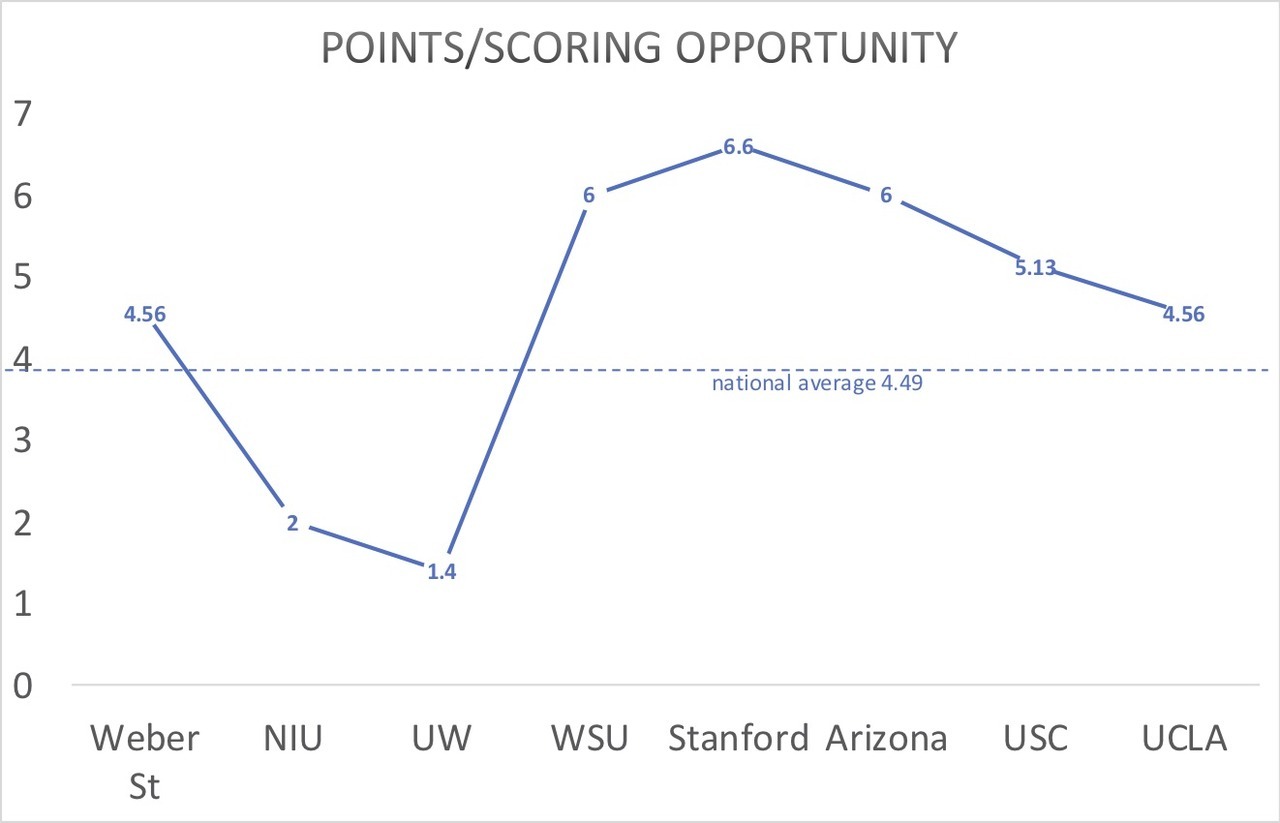
Way above average in points per opportunity for most of the last four games.
So, is this improvement for real? Or have we just been playing some bad teams? Connelly thinks our strength of schedule is pretty darn good – he ranks our Resume S&P+ at 12th in the nation.. (As an aside, the SOS argument is addressed in the post I linked to, and I suggest everyone give it a read – especially in regards to the G5 vs P5 in the playoffs debate).
S&P+ projects that Utah finishes the season with one more conference loss. I gave a breakdown of what that means for our chances at taking the Pac12 south here. I think even with the loss we win the south this year.
But back to the offense, is all of this for real? I guess only time will tell, but the metrics look to me like the offense has found its groove.
-
Anonymous
InactiveI love it when you post this info. Thank you!
-
AvidUte
ParticipantThis is good stuff! Thanks! Nice to actually see some real data when talking about how good the team is or isn’t.
-
 noneyadbParticipant
There are two people on this board that deserve a red thumb, and you shakeit, are definitely one of them. I am cautiously optimistic about Huntley going forward. Teams are going to lean heavier on taking Zack away and forcing Huntley to beat them. Thank God Covey is back from his mission…
-
-
AuthorPosts
- You must be logged in to reply to this topic.
